
Introduction
Source: NYC Office of the Director of Food Policy, Food Metrics Report 2018
In the days of vinyl, songs on the b-side got little air play and never made the charts, even though they often were as good as—or sometimes better than—the hits. As we reviewed New York City’s 2018 Food Metrics Report, released in December by the Mayor’s Office of Food Policy, we identified a number of “b-side food metrics” that would enrich our understanding of the food system. Yet these are rarely given proper air time, and as a result are often overlooked by advocates. Because these already collected and public data are sometimes hard to find, not aggregated and organized as food metrics, they remain hidden in plain sight. In the examples that follow, we illustrate the value of these data sources in answering important policy questions for each of the Food Metrics Report’s four topical areas.
Addressing Food Insecurity in New York City
The Food Metrics Report provides data on the number of people who participated in the Supplemental Nutrition Assistance Program (SNAP) in 2017. Additional data from the Human Resources Administration (HRA), which runs the SNAP program in New York City, provides important context for the participation rate. HRA calculates the SNAP Program Access Index, an estimation of the percentage of individuals likely to be eligible for SNAP, because their income is below 125% of the federal poverty line, who participate in the program. These data suggest that the city has a higher participation rate than the national average (Figure 1), but that additional efforts to publicize the benefits of SNAP, reduce stigma, and make the application and re-certification process easier may help to reach the approximately 16% of New Yorkers who qualify but choose not to enroll in SNAP.
As the 2018 Food Metrics Report points out, the participation rate for older adults was 70.9%, illustrating the importance of the efforts described in the report to enroll more eligible seniors. Another important population is low-income students who qualify for SNAP but do not participate. A recently released General Accounting Office study estimates that nationwide, 57% of eligible college students (1.8 million) do not receive SNAP benefits.
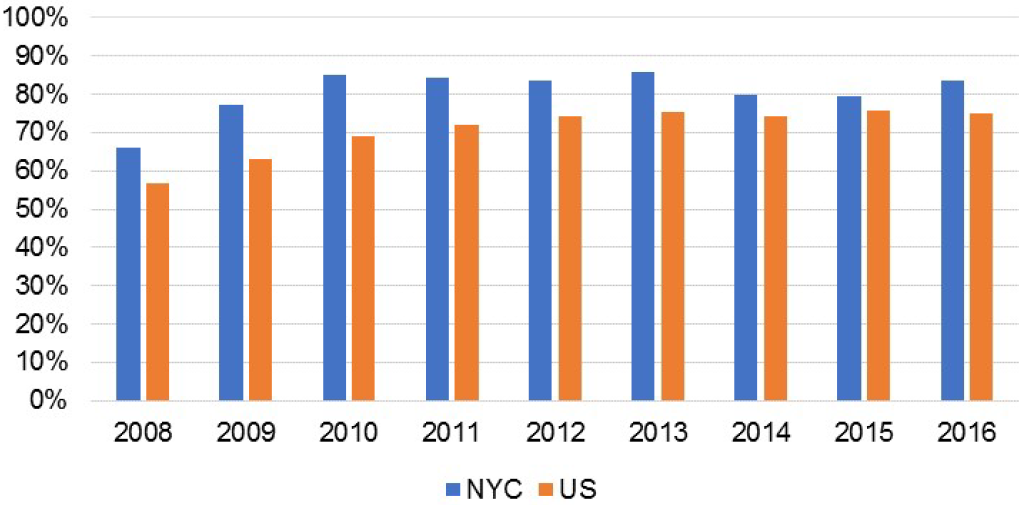
Figure 1. SNAP Program Access Index. Source: NYC Open Data.
Furthermore, while city- and borough-level SNAP participation data illustrate the overall impact of SNAP on low-income New Yorkers, differences in community-level SNAP participation rates raise additional policy questions. District Resource Statements, City Charter-mandated annual reports to the City’s community boards, provide detailed information about the budgets and services different agencies provide at the community district level. A recent analysis of community district-level SNAP participation between 2012 and 2016 found varying changes in participation in the program from community to community, with participation in neighborhoods like Bushwick dropping 28% and Bayside growing 8%. These differences may reflect demographic and economic changes, such as gentrification or growing immigrant populations, that may justify redeploying outreach and case management services.
Improving City Food Procurement and Services
The 2018 Food Metrics Report details the nutritional quality of the more than 238 million meals and snacks that 11 different New York City agencies procure, prepare, and serve. Appendix H of the report shows the number of feeding programs operated by city agencies, the meals and snacks they serve, and the number of programs in compliance with the city’s nutrition standards, which were established in 2008. But while the local law establishing the food metrics report focused on adherence to the city’s standards, an equally important policy question is whether city meals are adequate in meeting the needs of the population.
Additional city data from sources like the City Planning Department and the Mayor’s Management Report can help advocates and policymakers examine whether and to what extent city-provided meals are keeping pace with the city’s changing demographics, particularly the growing numbers of older New Yorkers. The Department of City Planning estimated that the population of New Yorkers over 65 would increase 17.5% between 2010 and 2020, but a report by the Comptroller’s Office suggests this may be an underestimate because nearly three quarters of the decade’s projected growth in older adults already occurred between 2010 and 2015.
Even if City Planning’s growth estimate is accurate, data from the Mayor’s Management Report on the number of home-delivered and congregate meals served by the Department for the Aging shows a relatively flat increase of 1.2% in total meals served between FY14 and FY18, with fewer home delivered meals targeted in FY18 and FY19 than were served in FY17 (Figure 2).
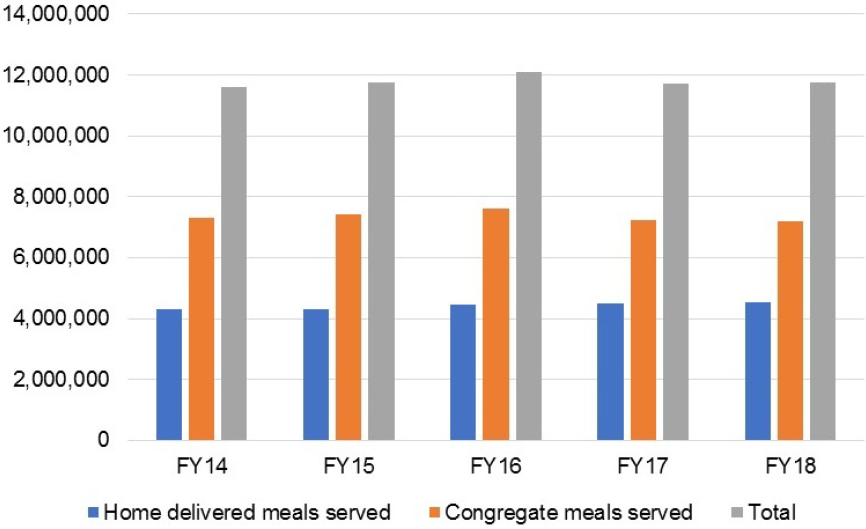
Figure 2. Number of home-delivered and congregate meals served by the NYC Department for the Aging. Note: Target for FY18: 4,390,494 meals; Target FY19: 4,390,494 meals. Source: NYC Mayor’s Office of Operations.
Advocates for older adults might ask policy questions such as how DFTA is addressing the apparent widening gap between the senior population and meal provision, and whether DFTA services and the agency’s budget are keeping pace with expected demographic change.
Increasing Healthy Food Access and Consumption
This section of the Food Metrics Report provides data on efforts to increase access to healthy food and to improve health through nutrition education. These include programs such as subsidies for supermarket construction and expansion in underserved neighborhoods and coupons to help low-income New Yorkers shop at farmers markets. School food is also a significant source of nutritious food for children from low-income households, and often is a healthier choice than the snacks that some children buy in lieu of eating in the school cafeteria. Data can help to answer several important policy questions: has participation in school meals changed over time? How many students will benefit from a policy adopted in 2017 to make school lunches free for all students? Do the school cafeterias meet sanitary standards for food preparation?
The Mayor’s Management Report publishes data on student enrollment and the number of breakfasts and lunches served daily (Figure 3). The number of enrolled students per meal served is an indicator of the percentage of students participating in breakfast and lunch. As Figure 4 illustrates, between FY08 and FY18, participation in breakfast increased while participation in lunch declined. Policymakers and advocates will want to know how participation rates in New York City compare with other large school districts and the policies and programs that will increase participation.
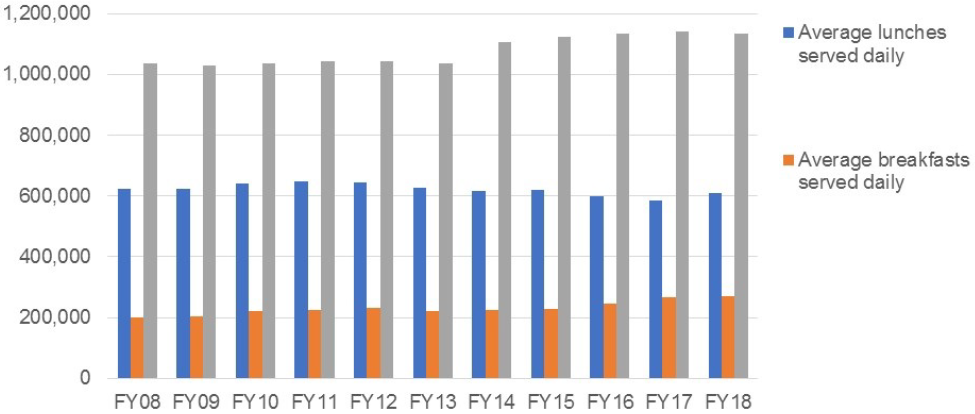
Figure 3. Average number of lunches and breakfasts served in the period 2008-2018. Source: Mayor’s Management Report FY08 to FY18.
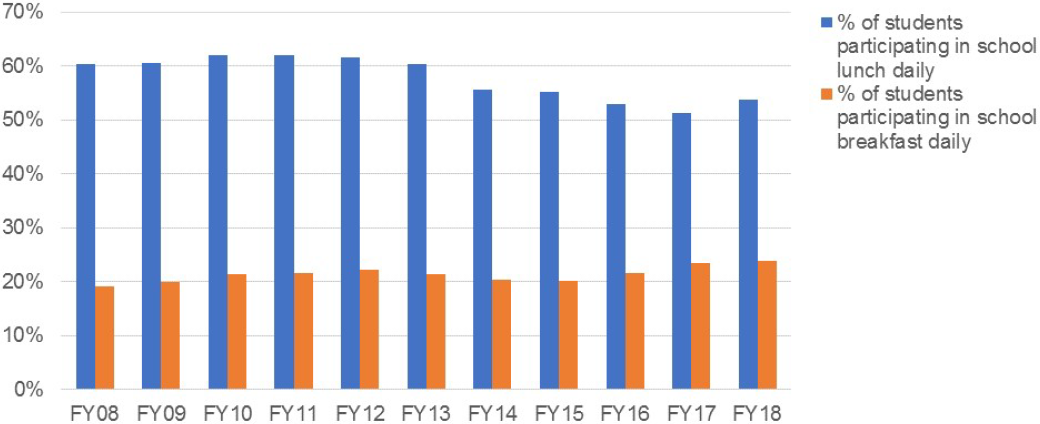
Figure 4. Participation in school lunch and breakfast (2008-2018). Source: Mayor’s Management Report FY08 to FY18.
For many years, advocates have lobbied for the adoption of universal free school lunch in New York City, which took effect in 2017. Among its varied goals, the policy aimed to eliminate the stigma of some children getting meals for free, to reduce the financial barrier among students from low-income families with incomes just above the level to qualify for free lunch, and to encourage increased consumption of nutritious school meals instead of less healthy off-campus alternatives.
Data published on the NYC Department of Education’s InfoHub on the poverty levels of students enrolled in public schools can be used to estimate the number of students in each school or school district who will benefit from this new policy. As Figure 5 shows, nearly 300,000 students enrolled in NYC schools during the 2017-2018 academic year were above the poverty level and would likely not qualify for free school lunch under the previous system, and therefore benefit from universal free school lunch. Armed with these metrics, parents, policymakers and other stakeholders can begin to advocate for programs and policies to encourage increased participation in the school lunch program and track the financial and health effects of free lunch at the school, district and city levels.
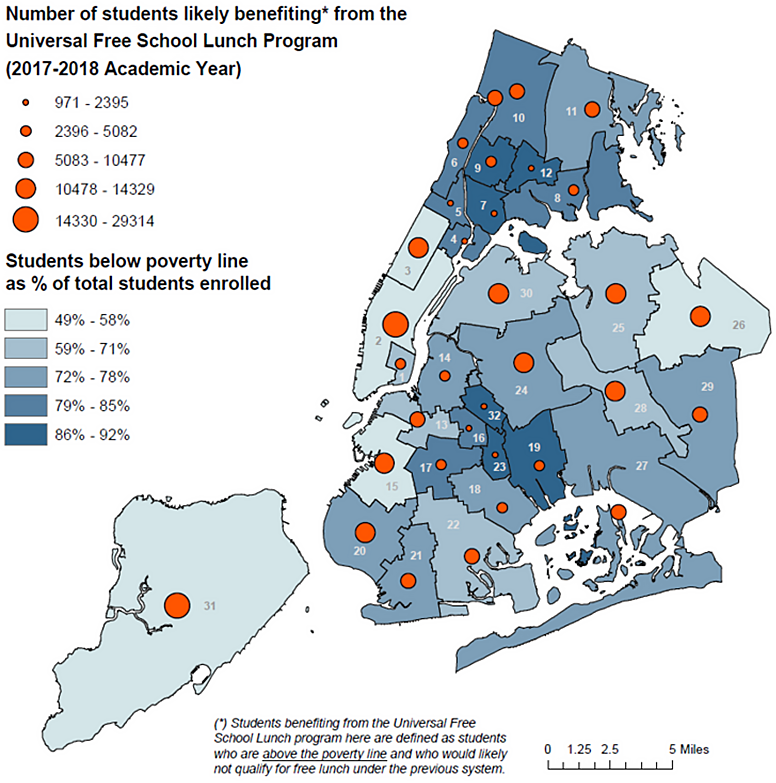
Figure 5. Number of students above the poverty line likely benefiting from Universal Free School Lunch by School District, 2017-2018 Academic Year. School District numbers are noted inside each School District boundary. Source: NYC Department of Education Demographic Snapshot.
Many school food advocates focus on nutritional quality, taste and appeal, and the provenance of ingredients. The Food Metrics report notes that in FY 2018, 26 of the DOE’s approximately 1,800 school buildings had their cafeterias renovated. Yet the issue of food safety is equally important, from a health perspective and as a factor influencing whether students choose to eat meals in their cafeterias. Local Law 112 of 2017 requires the Department of Education and Department of Health and Mental Hygiene to publish cafeteria inspection results on their websites. An analysis of this data by CUNY’s Newmark School of Journalism found that in 2017, nearly 700 school cafeterias received at least one critical health violation, with more than half indicating mice, rats, roaches and other insects in food preparation and eating areas.
Supporting a Just and Sustainable Food System
The final section of the Food Metrics Report focuses on programs and policies designed to help farmers in the city’s watershed manage their farms sustainably, make the Hunts Point Food Distribution Center resilient to weather events and more energy efficient, increase food waste composting, promote good food jobs through entrepreneurship, and support urban farms and gardens to provide multidimensional health, nutrition, and community benefits, particularly in low-income communities and schools. Data from other city agencies can help advocates and policymakers identify ways to expand food production and make food employment more just. Two different examples are:
- Lists of city owned vacant land that is suitable for new farms or gardens published by the Department of Citywide Administrative Services pursuant to Local Law 48 of 2011, and by the Department of Parks and Recreation pursuant to Local Law 49 of 2018, can guide communities interested in putting parcels in their neighborhoods to productive use and raise policy questions about the adequacy of city resources to support new farms and gardens, the sufficiency of budgets for programs like the Parks Department’s GreenThumb program, the potential for NGOs to provide such support, and the role of the urban agriculture plan proposed by City Council Int. No. 1058 in expanding urban agriculture.
- Annual Data published by the NYC Department of Consumer Affairs documents the number of complaints about the city’s paid sick leave law received and resolved. The law, which requires employers with five or more employees to provide paid sick leave and those with fewer than five to provide unpaid sick leave, is particularly important for workers in the food industry, especially low-paid and non-unionized workers like waiters, cooks and delivery people who have not previously had such protections. The law also protects customers of food businesses who might otherwise be exposed to foodborne illnesses if food workers forced by the fear of job or wage loss continued to work while sick. Data on complaints can be helpful to organizations that advocate for and support low-wage workers and may raise questions about whether the relatively low numbers of complaints reflects compliance with the law, limited knowledge about its provisions, or obstacles faced by workers to filing formal complaints.
Conclusions
The annual Food Metrics Reports are useful snapshots to help track various programs and policies that affect the food system. But their format and presentation, shaped in part by the 2011 City Council authorization, may need updating. This article shows that there are many more metrics produced by city agencies that can be used by interested New Yorkers, policymakers, and advocates to monitor important aspects of the food system, lobby for new resources, support effective initiatives, and design and implement complementary programs. The data are often not presented as food metrics and can be hidden in public documents like district needs statements or management reports that are unfamiliar to many.
In a report that CUNY Urban Food Policy Institute investigators published last year, we made several recommendations for a New York City Food Metrics 2.0. These include:
- Providing denominators as well as numerators for relevant metrics.
- Selecting additional indicators, including some suggested here.
- Adding other sources of data and creating a unified publicly available data platform.
- Involving more constituencies inside and outside city government in the process of developing and assessing the metrics.
- Making assessment of progress in achieving a more equitable New York City food system a priority.
- Focusing on outcomes as well as implementation
- Presenting analyses and frameworks for interpreting changes in metrics as well as describing them
In our earlier report, we provided a rationale and some suggestions for implementing these steps.
By revisiting the content and format of the annual food metrics report, the Mayor’s Office and the City Council can make a useful report even more helpful for policy makers, advocates and New York City eaters who want to improve the city’s food system.